
Here is the first time I will be doing a review of an upgraded CPU. I have been using the FX-6300 for over 12 months and it is a great budget CPU at $130AUD while I didn’t have any problems with it I felt like it was slowly losing strength with the latest AAA games and multi-threaded programs.
I will be comparing my FX-6300 at 4515 Mhz with the FX8320E at 3200 Mhz (stock) and also at 4730 Mhz. All tests are ran with 16GB Ram CL10 (10-10-10-30-2T) with AMD R9 290 947/1250.
The programs that I will be using:
Catzilla
Here we see a good benchmark. I have ran this at the 720p preset to make sure it is all CPU bound while I could have run it at 1080p.
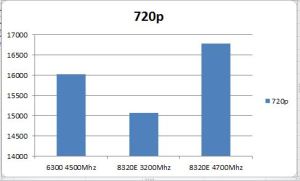
(Higher is better)
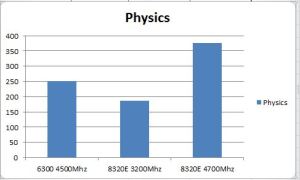
Here you can see that the 6300 still holds its head up but when you add those 2 extra cores even tho its 1500Mhz slower there is not a massive difference between them but as you can see once the 8320E is overclocked it is over 100 more than the 6300.
This score here is the overall score at 720p. You can see the difference that the overclock on the 8320E has made. While at stock it did hold it weight but it was still behind the 6300.
Cinebench 11.5
(Higher is better)


This Test is all about rendering with either single core or multi core options and here you can see that while at stock the multi core score of the 8320E is slightly higher then the 6300, but when it comes down to the single core it is lacking the performance.
Firestrike
This 3dMark test is the basic one. I decided not to do Extreme or Ultra as they are at a higher resolution, with that will take pressure off the CPU.
(Higher is better)

Here it shows that the 2 extra cores almost make up the difference between 4500Mhz and 3200Mhz.
Geekbench 3
(Higher is better)
Here the 8 cores of the 8320E really shine, while still clocked at stock it will be just slower then a pushed 6300.Clock speed is key with Single Threaded and while L2 and L3 cache does help the 8320E at stock it doesn’t make the difference.
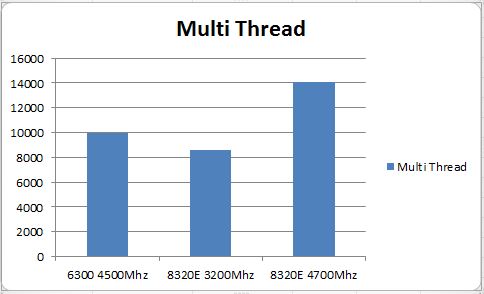
HWBotPrime
(Higher is better)

This test here is multicore and calculates the raw performance of the cores working together. The 8320E at stock is slightly faster then the 6300 but not by much.
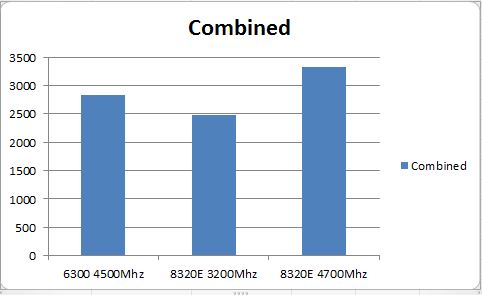
Realbench V2
(Higher is better)

This test is all about complete system score. it does multitasking, video/image rendering to see how it will perform. Again the 6300 keeps holding strong with that overclock against the stock
SuperPI
(Lower is better)

Here we see where clock speed is key while calculating PI to 32 million digits. Here is where we separate the single core boys and men.
Unigine Heaven
(Higher is better)

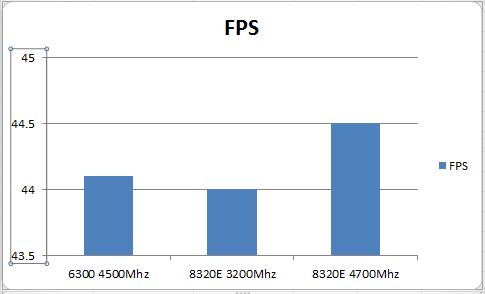
While Heaven is a great benchmark it is more catered to gamers as it is mainly GPU bound. There is still difference between the 3 settings you can see that the 2 extra cores and higher clock speed does help.
Unigine Valley
(Higher is better)


Valley is a more intense version of Heaven. Again it is GPU bound but the final score is where clock speed is where it helps it win again.
Don’t forget to check out the second part of this review where i show the gaming benchmarks and the difference between them as well.


Great review, really informative and detailed. Keep it up!
LikeLiked by 1 person
Thanks man it means a lot
LikeLike
Needs more benchmarks.
LikeLike
What did you have in mind? I done my best with the programs that I have.
LikeLike